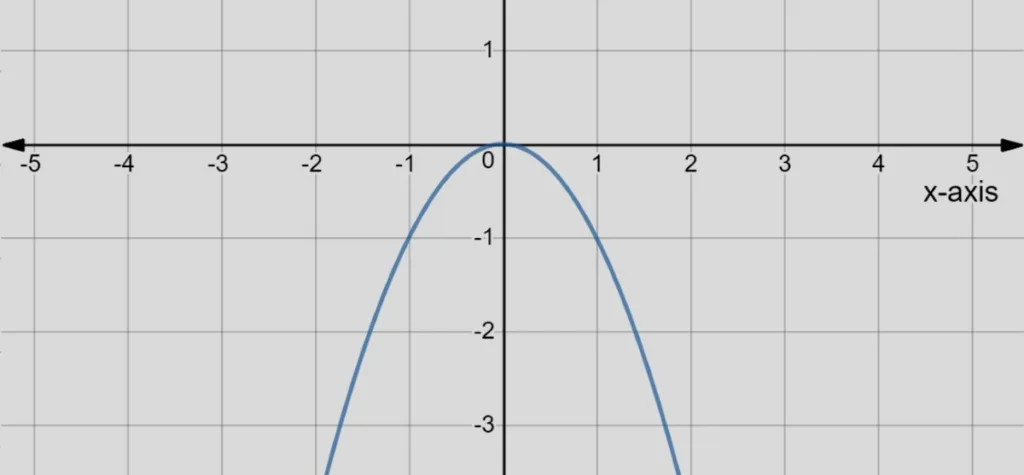
In mathematics, a parabola is a plane curve which is mirror-symmetrical. It is U-shaped or upside-down U-shaped. Below is an example of a concave-down parabolic curve.
When cattle prices rise and fall, they almost always form a concave-down parabolic curve. Notice, on the Cattle Range graph below, what happened to cattle prices from 2013 to 2016. The stocker steer prices (blue line) came down at about the same rate that they went up. The same thing happened with feeder steer prices and fat steer prices – but at less severe rates.
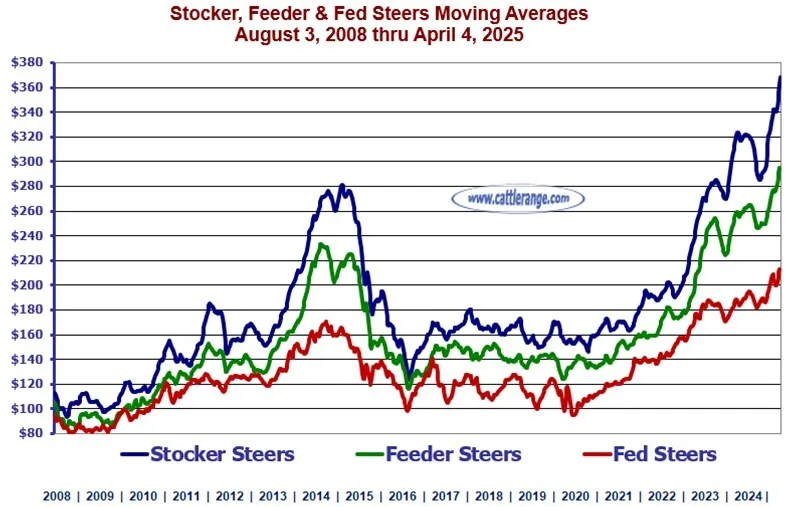
Now, look at what is currently going on with stocker steer prices (blue line). They have been increasing at a very steep rate. You can bet your bottom dollar that when cattle prices fall, they will fall at the same rate. There won’t be any warning. One day, you will be on top of the world. The next day, you will be plummeting toward the bottom and disaster.
Learn from history… Calf prices were quickly reduced by 50% in 2016. Will you be prepared for the upcoming drop in calf prices? If not, what do you need to do to get prepared? Your family is counting on you.
Share this Post