I have subscribed to “The Weekly Market Summary” put out by The Cattle Range for over 14 years. I receive it via email every Saturday morning. If you want up-to-date news, market reports and commentaries, this weekly email is a must!
Several times within the last six years, I have asked Craig Purvines at The Cattle Range for permission to share his “10-Year Moving Average” graph in our quarterly Newsletters and/or weekly PCC Updates. I love this graph! In addition to showing the current cattle prices, this graph provides a 10-year history of weekly cattle prices. Those who are able to learn from history will avoid many mistakes. Pictured below is last week’s graph.
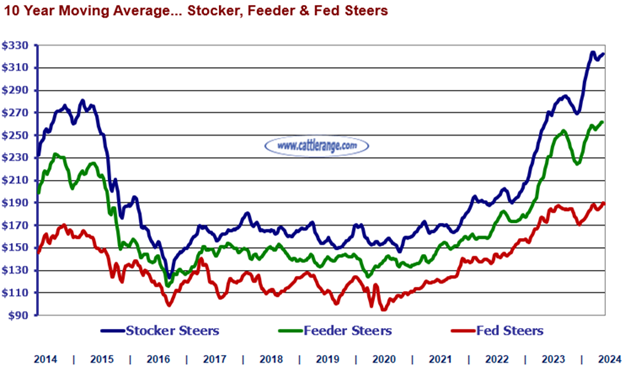
As you can see, we experienced record-high calf prices in 2014 and 2015. That was in the previous cattle cycle. We didn’t think it could get any better – but it did! Calf prices are now $40 per hundredweight higher than they were in the 2014/2015 time period. On a 500-pound steer, that is a whopping $200 more per head! WOW! We are in uncharted territory! We are living the dream!
The first thing I noticed when I saw this graph last Saturday morning was that calf prices (blue line) were literally about to go Off The Chart! Craig will soon need to increase the height of this graph to keep up with the times. These are the BEST OF TIMES! Enjoy them while they last!